CWS Assists Undergraduate Student Research Project
Background
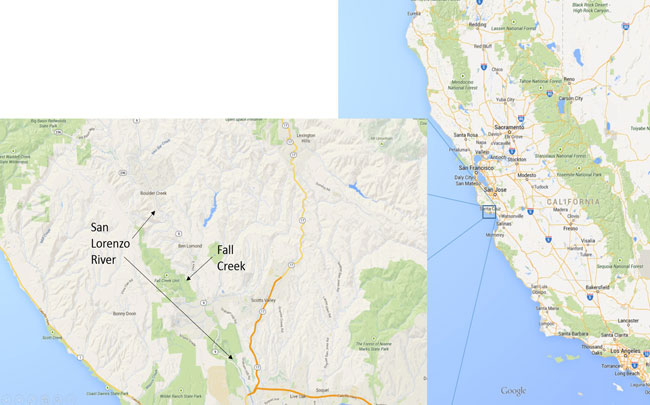
 The San Lorenzo Watershed in Santa Cruz County, California is a large coastal drainage system in a temperate rainforest that funnels into the San Lorenzo River. More than 40 creeks feed into the river that eventually drains out into the Pacific Ocean, at the northern tip of Monterey Bay.
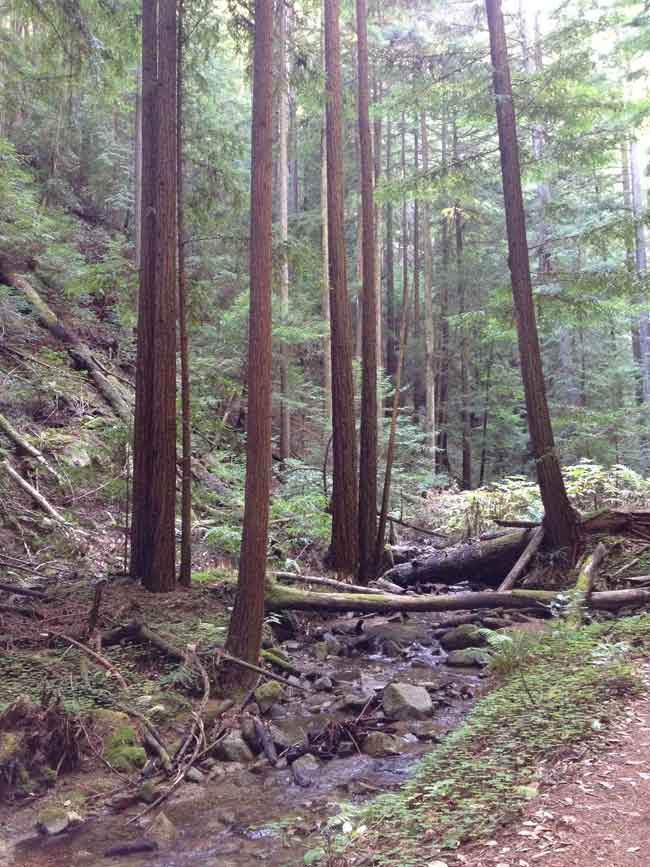
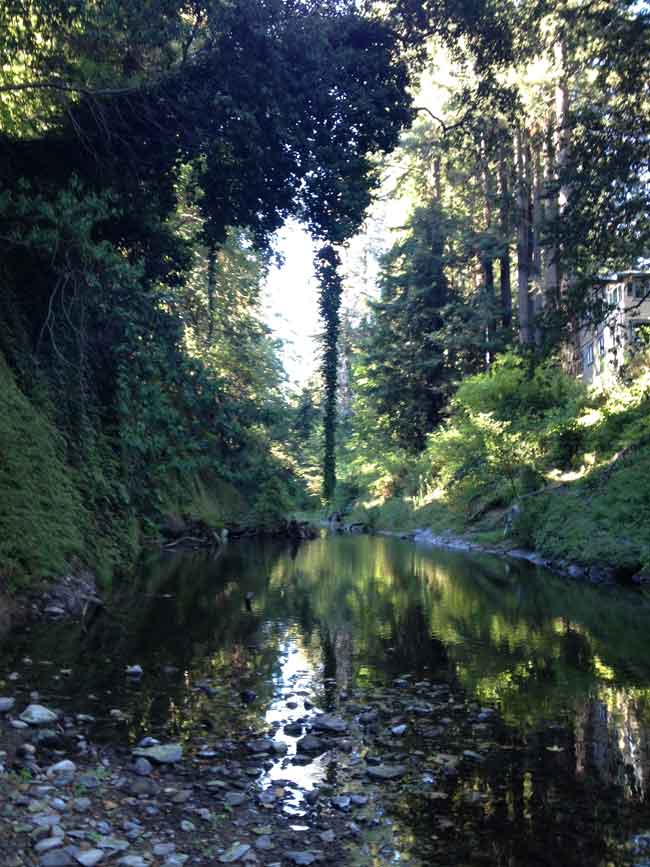
The San Lorenzo Watershed creeks are generally spring fed, including Fall Creek. The Fall Creek Unit of Henry Cowell Redwoods covers the full extent of Fall Creek from beginning to end where it meets the river.
The purpose of the research project is to see how stream water temperature fluctuates throughout the length of the creek, during the driest time of year (September) in the context of this region's severe ongoing drought.
The Study
Small temperature sensors were placed out in the creek from the beginning to the intersection with the San Lorenzo River. These sensors are battery powered and programmed to take a temperature reading every 10 minutes, 24 hours a day every day. With each temperature reading they take, they also take a reading of light intensity measured in a unit called Lux.
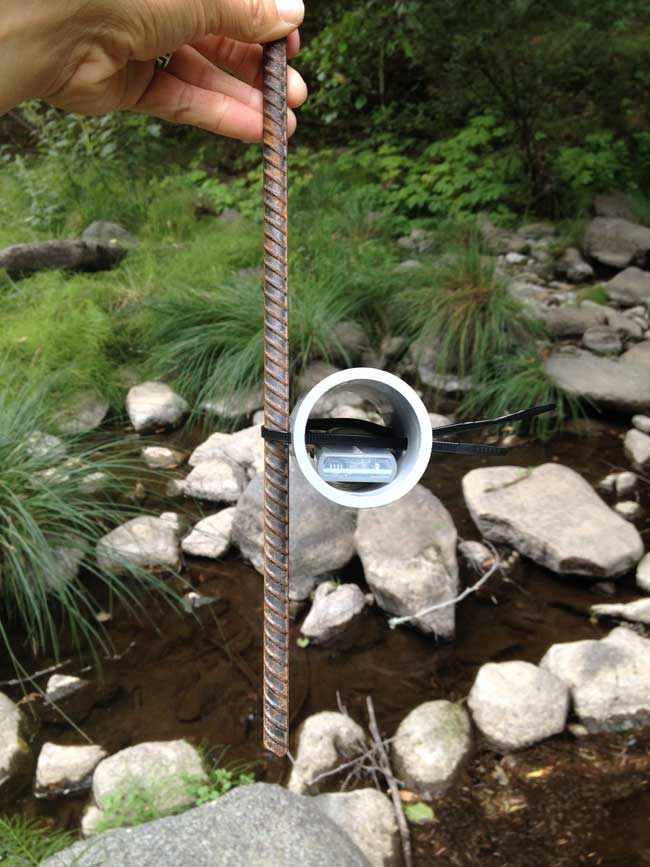
I used a Clean Water Store Total Dissolved Solids (TDS) meter to take a reading at each of the sites to see how the amount of dissolved ions in the water changes from the top of the creek to the bottom. The sensors were left out all for different amounts of time, but collectively they all overlapped 1 week. I had at least 4,600 temperature readings after only a week!
Site 0 is the beginning of Fall Creek. It comprises almost exclusively of cold groundwater. Site 6 is the end of the creek and FC-SL is in the mixing zone of the creek and the warmer water river.
What happened?
The data shows the creek generally warms from the top to the bottom. Total Dissolved Solids increases as well down the creek. See the plot to the right. 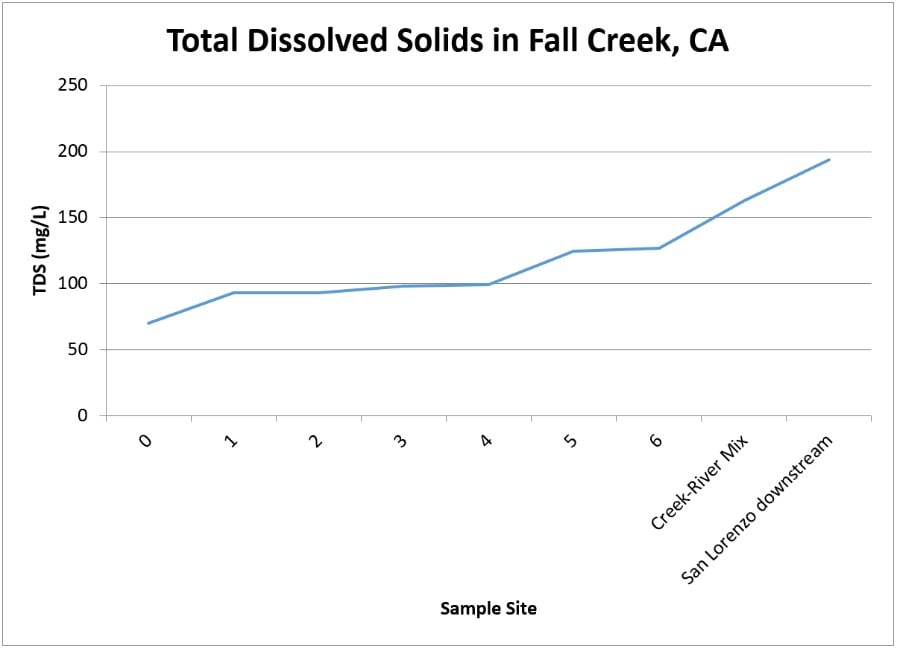 Groundwater in this area is naturally highly filtered water. The water at Site 0 likely represents the TDS of the groundwater beneath the State Park as there are no other inputs at the source of the creek. Toward the end of the creek however, dissolved solids are added to the stream from other incoming tributary streams, runoff from residential irrigation systems, and leaky septic systems.
I sorted through all the temperature readings and was able to produce the plot below. It shows temperature on the vertical axis and time throughout that week on the horizontal axis. Each different colored line represents a different site.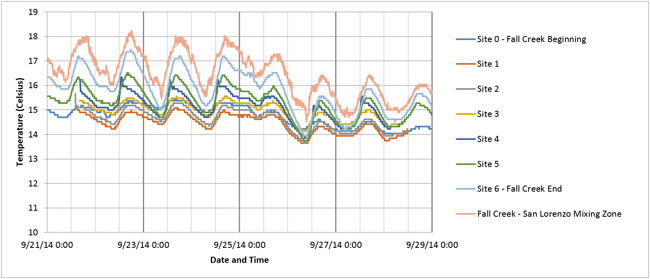
Thoughts as to why?
Each hump and valley is a daily temperature fluctuation cycle. The darkened lines represent two day increments. Interestingly, the peak temperature of the day appears to come right before sunset, not at midday. In the same way, the lowest temperature of the day comes right before sunrise, not at midnight. It appears that the water tends to keep cooling until the sun hits it, and keep warming until the sun leaves it. Overall, at the top of the creek the maximum temperature reached during the week is 2.5 degrees Celsius (4.5 degrees Fahrenheit) cooler than the bottom. The increase in TDS from top to bottom of the creek is likely due to runoff from the surrounding human development closer and closer to the river.
 This difference in temperature ranges within a small stream have strong ecological implications. Stream organisms are specifically adapted to their particular ecosystem. A variation in temperature of 2.5 degrees can impact their ability to regulate their body temperature and to maintain the eating habits they have adapted to. Exacerbated stream temperature ranges are yet another effect the drought has had on our water resources. Not only is there not as much water this year, but the natural surface water that is here is warming and cooling at much more extreme temperatures.
I am a soon to be graduate of University of California, Santa Cruz in Environmental Geology in the Earth & Planetary Sciences department and a technical assistant at Clean Water Store. CWS has helped me accomplish my final research project with my adviser at the USGS. Many thanks Gerry!